Visualizations
Client/Server Road Map

This diagram marks a pivotal point in my career. I was doing research for Jeff Tash (a prominent technology guru) and came up with the idea that we should produce a "map" depicting what was happening in the industry. The goal was to use a visual context to simplify what would otherwise be complex subject matter. The result proved to be amazingly successful, with more than one million copies being distributed worldwide.
Custom Timeline
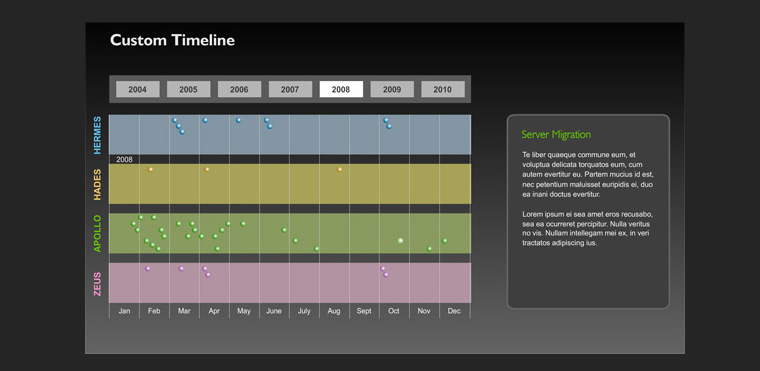
To be added...
Skills Matrix

A while back I jottend down a list of what I considered to be some of my marketable skills so that I could do a quick assessment. After coming up with the initial list I started to rank the items in order of proficiency. Then I added a timeline for each skill so that I could track not only how much experience I have but also in what time period these skills were developed. And then to finish it off I color coded the timelines so that it would show the intensity of the skill in practice at any given point in time. Voila! What started as a simple list transformed into a rather interesting multi-dimensional visualization.
Work History Timeline
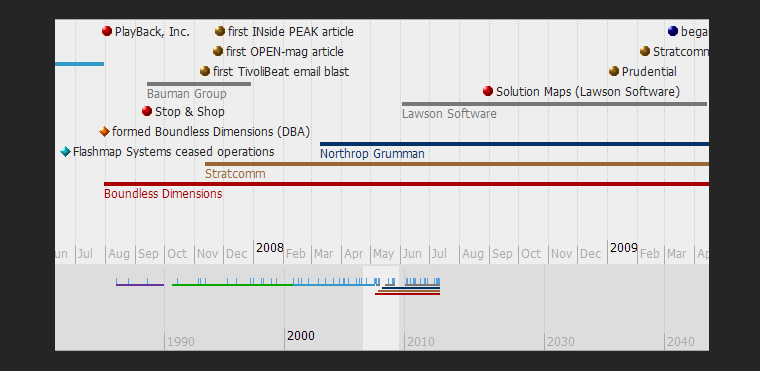
The notion of tracking information based on time has always fascinated me because it's such an obvious characteristic of how we think about things that have happened. This example is a timeline I built to depict events that have taken place in my work history. The timeline itself is an open source project called Simile that was developed at MIT.